So let me set the stage for this blog. I recently completed a storage assessment for a customer. Without boring you with the details one of the major areas of concern was the Exchange environment, I was provided with proem data from two active Exchange cluster member to be used for analysis. The proem data was collected on both cluster members over the course of a week at 30 second intervals – THAT’S ALOT OF DATA POINTS. Luckily the output was provided in .blg (binary log) format because I am not sure how well Excel would have handled opening a .CSV file with 2,755,284 rows – YES you read that correctly 2.7 million data points – and that was after I filtered the counters that I did not want.
The purpose of this post is to walk through how the data was ingested and mined to produce useful information. Ironically having such granular data point while annoying at the onset proved to be quite useful when modeling the performance.
First let’s dispense with some of the requirements:
- Windows XP, 2003
- Windows 2003 Resource Kit (required for the log.exe utility)
- MSDE, MSSQL 2000 (I am sure you can use 2005 – but why – it is extreme overkill for what we are doing)
- A little bit of skill using osql
- If you are weak 🙂 and using MSSQL 2000 Enterprise Manager can be used
- A good SQL query tool
- I recommend SQL Manager 2005 Lite (http://sqlmanager.net/en/products/mssql/manager/download) BTW – This is freeware
- MS Excel (I am using 2007 – so the process and screen shots may not match exactly if you are using 2003, 2000, etc…)
- Alternatively a SQL reporting tool like Crystal could be used. I choose Excel because the dataset can easily be manipulated once in a spreadsheet.
- grew for Windows (http://gnuwin32.sourceforge.net/packages/grew.htm) – ensure this is in your path
OK – now that the requirements are out of the way let’s move on. I am going to make the assumption that the above software is installed and operational, otherwise this blog will get very, very long. NOTE: It is really important that you know the “sa” password for SQL server.
Beginning the process:
Step 1: Create a new data base (my example below uses the data base name “test” – you should use something a bit more descriptive)
Microsoft Windows XP [Version 5.1.2600]
(C) Copyright 1985-2001 Microsoft Corp.C:\Documents and Settings\bocchrj>osql -Usa
Password:
1> create database test
2> go
The CREATE DATABASE process is allocating 0.63 MB on disk ‘test’.
The CREATE DATABASE process is allocating 0.49 MB on disk ‘test_log’.
1> quitC:\Documents and Settings\bocchrj>
NOTE: This DATABASE will be created in the default DATA location under the SQL SVR install directory. Make sure you have enough capacity – for my data set of 2.7 million rows the database (.mdf) was about 260 MB.
Step 2: Create an ODBC connection to the database
A nice tutorial on how to do this can be found here: http://www.truthsolutions.com/sql/odbc/creating_a_new_odbc_dsn.htm
Two things to note:
- Use the USER DSN
- Use SQL Server Authentication (NOT NT Authentication) the user name is “sa” and hopefully you remembered the password.
Step 3: Determine relevant counters
Run the following command on the .blg file: log -q perf.blg > out.txt
This will list all of the counters to the text file out.txt. Next open counters.txt in you favorite text editor and determine which counters are of interest (NOTE: Life is much easier if you import a specific counter class into the database, create new a new database for a new counter class)
Once you determine the counter class e.g. PhysicalDisk run: log -q perf.blg | grew PhysicalDisk > counters.txt
Step 3: Import the .blg into the newly created database.
NOTE: There are two considerations here
Are the data points contained in a single .blg file (if you have 2.7 million data points this is unlikely)? If they are the command to do the import is fairly simple:
log perf.blg -cf counter.txt -o SQL:DSNNAME!description
If the data points are contained in a number of files make sure that these files are housed in the a directory. You can use the following PERL script to automate the import process (NOTE: This requires that PERL be installed – http://www.activestate.com/Products/ActivePerl/)
#!/usr/bin/perl -w
# syntax: perl import_blg.pl input_dir odbc_connection_name $counter
# e.g. – perl import_blg_pl#DO NOT EDIT BELOW THIS LINE
$dirtoget=”$ARGV[0]”;
$odbc=”$ARGV[1]”;
$counter=”$ARGV[2]”;
$l=0;opendir(IMD, $dirtoget) || die(“Cannot open directory”);
@thefiles= readdir(IMD);
closedir(IMD);foreach $f (@thefiles)
{
unless ( ($f eq “.”) || ($f eq “..”) )
{
$label=$l++;
system “log \”$dirtoget\/$f\” -cf $counter -o SQL:$odbc!$label”;
}
}
If the import is working properly you should see output similar to the following:
Input
—————-
File(s):
C:\perf_log – 30 second interval_06132201.blg (Binary)Begin: 6/13/2007 22:01:00
End: 6/14/2007 1:59:30
Samples: 478Output
—————-
File: SQL:DSNNAME!1.blgBegin: 6/13/2007 22:01:00
End: 6/14/2007 1:59:30
Samples: 478The command completed successfully.
Step 4: OK – The data should now be imported into the database. We will now look at the DB structure (table names) and run a test query. At this point I typically start using SQL Manager 2005 Lite but you can continue to use osql or Enterprise Manager (uggghhhh). For the purposes of cutting and pasting examples I used osql.
This is not a DB 101 tutorial but you will need to be connected to the database we created earlier.
Once connected run the following query (I cut out non relevant information in the interest of length):
C:\Documents and Settings\bocchrj>osql -Usa
Password:
1> use test
2> go
1> select * from subjects where type = ‘u’ order by name
2> go
CounterData
CounterDetails
DisplayToID
(3 rows affected)
1>CounterData and CounterDetails are the two tables we are interested in:
Next lets run the query to display the first 100 rows of the CounterDetails table to verify that the data made its way from the .blg file to the database
1> select top 20 * from counterdetails
2> go
SHOULD SCROLL 20 RECORDS
(20 rows affected)
1>quitStep 5: Determining what to query
Open counters.txt in your favorite browser and determine what you want to graph – there are a number of metrics, pick one you can get more complicated once you get the hang of the process.
e.g. When you open the text file you will see a number of rows that look like this – Take note of bold sections below, this is the one of the filters that will be used when selecting the working dataset
\test\PhysicalDisk(4)\Avg. Disk Bytes/Read
\test\PhysicalDisk(5)\Avg. Disk Bytes/Read
\test\PhysicalDisk(6 J:)\Avg. Disk Bytes/Read
\test\PhysicalDisk(1)\Avg. Disk Bytes/Read
\test\PhysicalDisk(_Total)\Avg. Disk Bytes/Read
\test\PhysicalDisk(0 C:)\Avg. Disk Write Queue Length
\test\PhysicalDisk(3 G:)\Avg. Disk Write Queue Length
\test\PhysicalDisk(4)\Avg. Disk Write Queue Length
etc…Once you determine which performance counter is of interest open Excel.
Step 6: Understanding the anatomy of the SQL query
SELECT
CounterData.”CounterDateTime”, CounterData.”CounterValue”,
CounterDetails.”CounterName”, CounterDetails.”InstanceName”
FROM
{ oj “test“.”dbo”.”CounterData” CounterData INNER JOIN “test“.”dbo”.”CounterDetails” CounterDetails ON
CounterData.”CounterID” = CounterDetails.”CounterID”}
WHERE
CounterDetails.”InstanceName” = ‘3 G:‘ AND CounterDetails.”CounterName”=’Disk Writes/sec‘ AND CounterData.”CounterDateTime” like ‘%2007-06-13%’
- The above query will return all the Disk Writes/sec on 6/13/2007 for the G: drive.
- In the above query I have BOLDED the VARIABLES that should be modified when querying the database. The JOINS should NOT be modified. You may add additional criteria like multiple INSTANCENAME or COUNTERNAME fields to grab, etc…. Below you will see exactly how to apply the query.
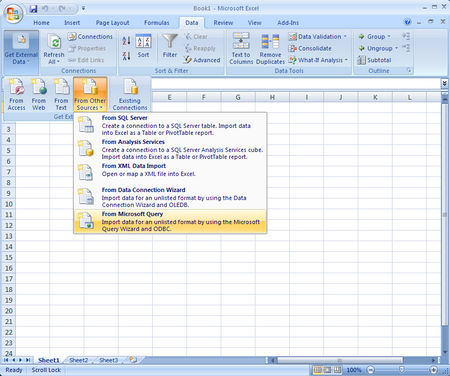
Step 7: Run the query from Excel (NOTE: Screen shots are of Excel 2003, the look and feel will be different for other versions of Excel)
Once you select “From Microsoft Query” the next screen will appear
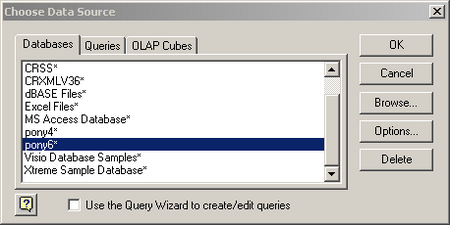
Select the DSN that you defined earlier. NOTE: Also uncheck the “Use the Query Wizard to create/edit queries. I will provide the query syntax which will make life much easier.Now you need to login to the database. Hopefully you remember the sa password.
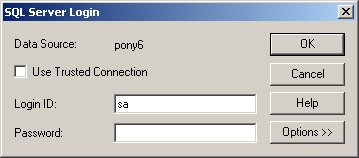
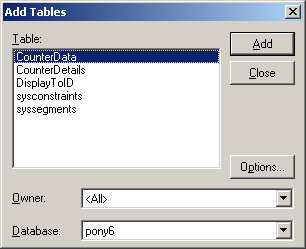
Once the login is successful – CLOSE the add tables window
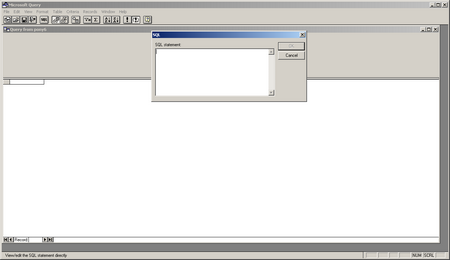
Now you will see the MS Query Tool Click the SQL button on the toolbar. Enter the SQL query into the SQL text box and hit OK. You will recite a warning – just hit OK and continue.
Use the query syntax explained above.
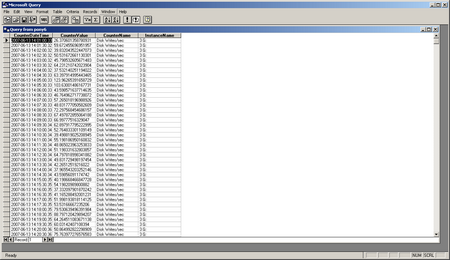
Once the query is complete it will return a screen that looks like this:
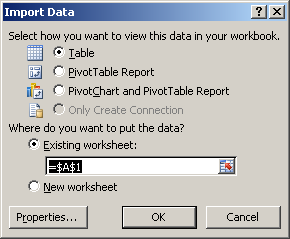
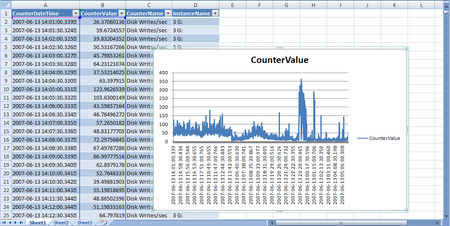
Now hit the 4th button from the left on the tool bar “Return Data” – this will place the data into Excel so that is can be manipulated:
Once the data is placed into Excel you can begin to graph and manipulate it.
I hope this was informative, if you find any errors in the process please place a comment to the post.

Great post, thanks a lot 🙂