Following a fit of rage last night after I inadvertently deleted 2 hours worth of content I have now calmed down enough to recreate the post.
The story starts out like this, a customer who recently installed a EMC CX3–80 was working on a backup project roll out, the plan was to leverage ATA capacity in the CX3–80 as a backup-to-disk (B2D) target. Once they rolled out the backup application they were experiencing very poor performance for the backup jobs that were running to disk, additionally the customer did some file system copies to this particular device and the performance appeared to slow.
The CX3–80 is actually a fairly large array but for the purposes of this post I will focus on the particular ATA RAID group which was the target of the backup job where the performance problem was identified.
I was aware that the customer only had on power rail due to some power constraints in their current data center. The plan was to power up the CX using just the A side power until they could de-commission some equipment and power on the B side. My initial though was that cache the culprit but I wanted to investigate further before drawing a conclusion.
My first step was to log into the system and validate that cache was actually disabled, which it was. This was due to the fact that the SPS (supplemental power supply) only had one power feed and the batteries where not charging. In this case write–back cache is disabled to protect from potential data loss. Once I validated that cache was in fact disabled I thought that I would take a scientific approach to resolving the issue by base lining the performance without cache and then enabling cache and running the performance test again.
The ATA RAID group which I was testing on was configured as a 15 drive R5 group with 5 LUNs (50 – 54) ~ 2 TB in size.
Figure 1: Physical disk layout

My testing was run against drive f: which is LUN 50 which resides on the 15 drive R5 group depicted above. LUNs 51, 52, 53 and 54 were not being used so the RG was only being used by the benchmark I was running on LUN 50.
Figure 2: Benchmark results before cache was enabled
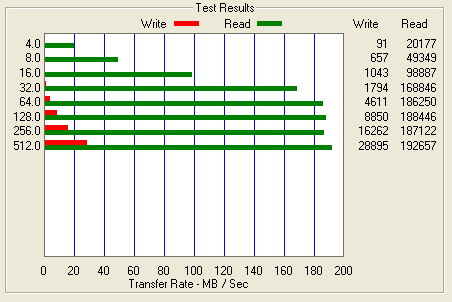
As you can see the performance for writes is abysmal. I will focus on the 64k test as we progress through the rest of this blog. You will see above that the 64k test only push ~ 4.6 MB/s. Very poor performance for a 15 drive stripe. I have a theory for why this is but I will get to that later in the post.
Before cache couple be enabled we needed to power the second power supply on the the SPS, this was done by plugging the B power supply on the SPS into the A side power rail. Once this was complete and the SPS battery was charged cache was enabled on the CX and the benchmark was run a second time.
Figure 3: Benchmark results post cache being enabled (Note the scale on this chart differs from the above chart)
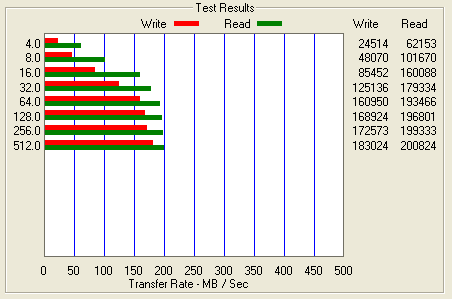
As you can see the performance increased from ~ 4.6 MB/s for 64k writes to ~ 160.9 MB/s for 64k writes. I have to admit I would not have expected write cache to have this dramatic of an effect.
After thinking about it for a while I formulated some theories that I hope to fully prove out in the near future. I believe that the performance characteristics that presented themselves in this particular situation was a combination of a number of things, the fact that the stripe width was 15 drives and cache being disabled created the huge gap in performance.
Let me explain some RAID basics so hopefully the explanation will become a bit clearer.
A RAID group had two key components that we need to be concerned with for the purpose of this discussion:
- Stripe width – which is typically synonymous with the number of drives in the the raid group
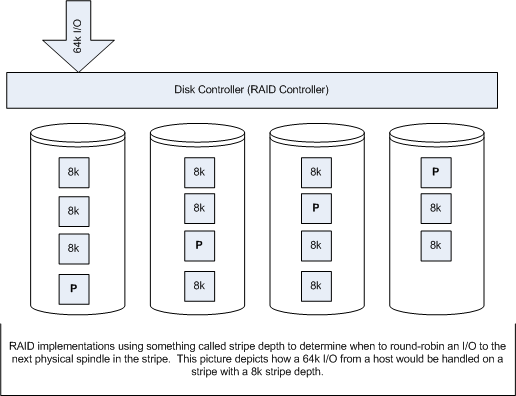
- Stripe depth – which is the size of the write that the controller performs before it round robin to the next physical spindle (Depicted in Figure 4)
Figure 4: Stripe Depth
The next concept is write cache, specifically two features of write cache know as write-back cache and write-gathering cache.
First lets examine the I/O pattern without the use of cache. Figure 5 depicts a typical 16k I/O on an array with and 8k stripe depth and a 4 drive stripe width, with no write cache.
Figure 5: Array with no write cache
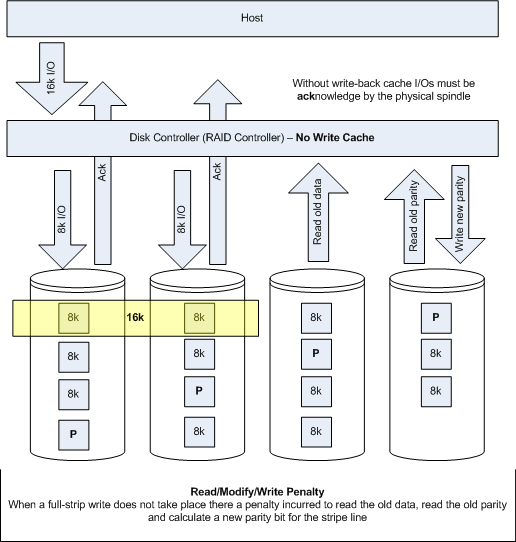
The effect of no write cache is two fold. First there is no write-back so the I/O needs to be acknowledge by the physical disk, this is obviously much slower that and ack from memory. Second, because there is no write-gathering full-stripe writes can not be facilitated which means more back-end I/O operations, affectionately referred to as the Read-Modify-Write penalty.
Now lets examine the same configuration with write-cache enabled. Depicted in Figure 6.
Figure 6: Array with write cache enabled
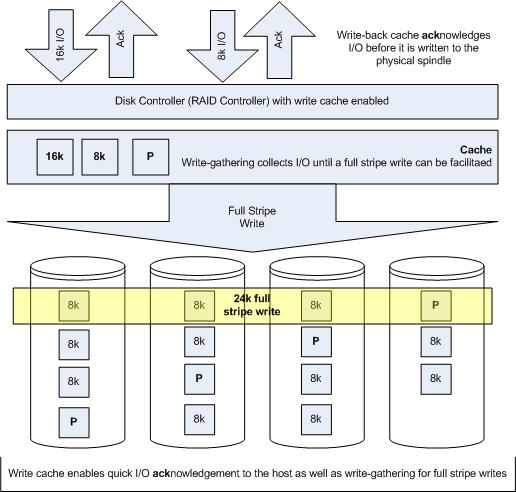
Here you will note that acks are sent back to the host before they are written to physical spindles, this dramatically improves performance. Second write-gathering cache is used to facilitate full-stripe writes which negates the read-modify-write penalty.
Finally my conclusion is that the loss of write cache could be somewhat negated by reducing stripe widths from 15 drives to 3 or 4 drives and creating a meta to accommodate larger LUN sizes. With a 15 drive raid group the read-modify-write penalty can be severe as I believe we have seen in Figure 2. This theory needs to be test, which I hope to do in the near future. Obviously write-back cache also had an impact but I am not sure that is was as important as write-gathering in this case. I could have probably tuned the stripe-depth and file system I/O size to improve the efficiency without cache as well.

Another point that needs to be made is that there is the assumption (even within EMC) that, if you disable the write cache, you retain the gather cache, you just don’t get the large write-back cache. This assumption is obviously wrong. I advise EMC customers to look into purchasing the QoS option.
D