EMC CX3-80 FC vs EMC CX4-120 EFD

This blog is a high level overview of some extensive testing conducted on the EMC (CLARiiON) CX3-80 with 15K RPM FC (fibre channel disk) and the EMC (CLARiiON) CX4-120 with EFD (Enterprise Flash Drives) formerly know as SSD (solid state disk).

Figure 1:  CX4-120 with EFD test configuration.

image

Figure 2:  CX3-80 with 15K RPM FC rest configuration.

image

Figure 3:  IOPs Comparison

image

Figure 4:  Response Time

image

Figure 5:  IOPs Per Drive

image

Notice that the CX3-80 15K FC drives are servicing ~ 250 IOPs per drive, this exceeds 180 IOPs per drive (the theoretical maximum for a 15K FC drive is 180 IOPs) this is due to write caching.  Note that cache is disabled for the CX4-120 EFD tests, this is important because high write I/O load can cause something known as a force cache flushes which can dramatically impact the overall performance of the array.  Because cache is disabled on EFD LUNs forced cache flushes are not a concern.

Table below provides a summary of the test configuration and findings:

Array CX3-80 CX4-120
Configuration (24) 15K FC Drives (7) EFD Drives
Cache Enabled Disabled
Footprint   ~42% drive footprint reduction
Sustained Random Read Performance   ~12x increase over 15K FC
Sustained Random Write Performance   ~5x increase over 15K FC

In summary, EFD is a game changing technology.  There is no doubt that for small block random read and write workloads (i.e. – Exchange, MS SQL, Oracle, etc…) EFD dramatically improves performance and reduces the risk of performance issues.

This post is intended to be an overview of the exhaustive testing that was performed.  I have results with a wide range of transfer sizes beyond the 2k and 4k results shown in this posts, I also have Jetstress results.  If you are interested in data that you don’t see in this post please Email me a rbocchinfuso@gmail.com.

Benchmarking De-Duplication and with Databases

In the interest of benchmarking de-duplication rates with databases I created a process to build a test database, load test records, dump the database and perform a de-dupe backup using EMC Avamar on the dump files.  The process I used is depicted in the flowchart below.

image

1.  Create a DB named testDB
2.  Create 5 DB dump target files – testDB_backup(1-5)
3.  Run the test which inserts 1000 random rows consisting of 5 random fields for each row.  Once the first insert is completed a dump is performed to testDB_backup1.  Once the dump is complete a de-dupe backup process is performed on the dump file.  This process is repeated 4 more times each time adding an additional 1000 rows to the database and dumping to a new testDB_backup (NOTE:  this dump includes existing DB records and the newly inserted rows) file and performing the de-dupe backup process.

Once the backup is completed a statistics file is generated showing the de-duplication (or commonality) ratios.  The output from this test is as follows:

image

You can see that each iteration of the backup shows an increase in the data set size with increasing commonality and de-dupe rations.  This test shows that with 100% random database data using a DB dump and de-dupe backup strategy can be a good solution for DB backup and archiving.

The effect of latency and packet loss on effective throughput

One of my customers who was running three replication technologies, XOsoft, PlateSpin and EMC MirrorView started experiencing issue when we relocated their DR equipment from the production facility where we staged and tested the applications to their DR location.

While having the Producion and DR environments on the LAN we successfully replicated Exchange with XOsoft, Operating Systems with PlateSpin and Data with MirrorView, once we moved DR infrastructure these components all failed. This prompted us to perform network remediation. The following are the results of a simple ping test that was performed using WinMTR.

image

The above chart shows the output from output from a simple test which shows packets, hops, latency and % packet loss. We ran this tests a number of times from different source and destination hosts with similar results. The originating host for this for this host was 192.168.123.6 in the chart below 192.168.120.1 is the first hop.

NOTE: the destination 192.168.121.52 was sent 414 packets but only received 384 (NOTE: this number worsens over time). This is consistent with the behavior that XOsoft, PlateSpin and MV are experiencing.

The graph below represent the impact of packet loss on bandwidth. As you can see 1% packet loss has a dramatic affect on relative bandwidth.

image

Using a bandwidth calculator found here http://www.wand.net.nz/~perry/max_download.php, we calculated the relative bandwidth using the metrics we observed.

  • An effective speed of ~ 30KB/s was calculated using 7% packet loss, a 10Mbit link and 90ms RTT
    • with 15ms RTT the effective speed is ~ 185 KB/s
  • An effective speed of ~ 128KB/s was calculated using 1% packet loss, a 10Mbit link and 90ms RTT
    • with 15ms RTT the effective speed is ~ 700 KB/s

These number are dramatic when compared to the expected 9 Mbit or 1152 KB/s

In conclusion a clean network is critical, especially with technologies like replication that rely on little or to no packet loss and the use of all the bandwidth available. Interestingly enough we seem to be seeing these sort of problems more and more often. My hypothesis is that more and more organizations are looking to implement DR strategies and data replication in a critical component to these strategies, understanding this I believe this problem will get worse before it gets better. For years many of these organizations have used applications and protocols which are tolerant of packet loss, congestion, collisions, etc… protocols like http, ftp, etc… Data replication technologies are far less forgiving so network issues that have most likely existed for sometime are rearing their head at inopportune times.

Oracle Storage Guy: Direct NFS on EMC NAS

I have been chomping at the bit to test VMware on dNFS on EMC NAS for a couple of reasons.  A number of my customers who are looking at EMC NAS in particular the NS20 would like to consolidate storage, servers, file services, etc… on to a unified platform and leverage a single replication technology like Celerra Replicator.   dNFS may offer this possibility, .vmdks can now reside on the a NFS volume, CIFS shares can be consolidated to the the NS20 and all can be replicated with Celerra Replicator.  The only downside to this solution that I can see is right now the replicated volumes will be crash consistent copies but I think with some VMware scripting even this concern can be addressed.  I hope to stand this configuration up in the lab in the next couple of weeks so I should have more detail and a better idea of is viability shortly.  You may be wondering why this post entitled Oracle Storage Guy…… the answer is I was searching the blogsphere for an unbiased opinion and some performance metrics of VMware and dNFS and this was the blog that I stumbled upon.

The performance numbers I have seen for VMware on dNFS come very close to the numbers I have seen for iSCSI, both technologies offer benefits but for the use case I mention above dNFS may become very compelling.  I recommend reading this post Oracle Storage Guy: Direct NFS on EMC NAS, is offers some great commentary on the performance characteristics and benefits of dNFS.

The Cache Effect

Following a fit of rage last night after I inadvertently deleted 2 hours worth of content I have now calmed down enough to recreate the post.

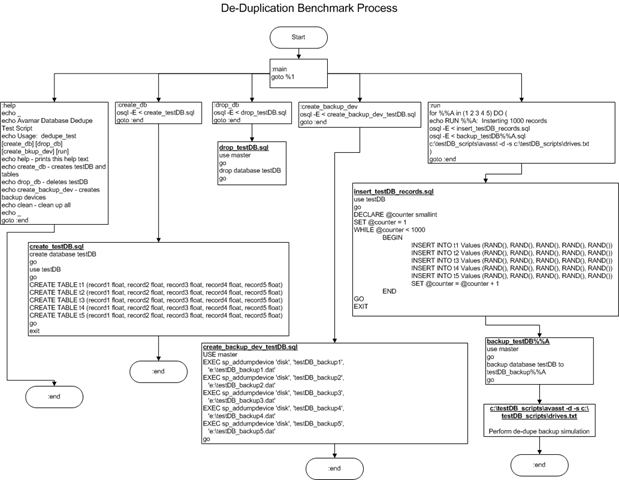
The story starts out like this, a customer who recently installed a EMC CX3–80 was working on a backup project roll out, the plan was to leverage ATA capacity in the CX3–80 as a backup-to-disk (B2D) target.  Once they rolled out the backup application they were experiencing very poor performance for the backup jobs that were running to disk, additionally the customer did some file system copies to this particular device and the performance appeared to slow.

The CX3–80 is actually a fairly large array but for the purposes of this post I will focus on the particular ATA RAID group which was the target of the backup job where the performance problem was identified.

I was aware that the customer only had on power rail due to some power constraints in their current data center.  The plan was to power up the CX using just the A side power until they could de-commission some equipment and power on the B side.  My initial though was that cache the culprit but I wanted to investigate further before drawing a conclusion.

My first step was to log into the system and validate that cache was actually disabled, which it was.  This was due to the fact that the SPS (supplemental power supply) only had one power feed and the batteries where not charging.  In this case write–back cache is disabled to protect from potential data loss.  Once I validated that cache was in fact disabled I thought that I would take a scientific approach to resolving the issue by base lining the performance without cache and then enabling cache and running the performance test again.

The ATA RAID group which I was testing on was configured as a 15 drive R5 group with 5 LUNs (50 – 54) ~ 2 TB in size.

Figure 1:  Physical disk layout

R5

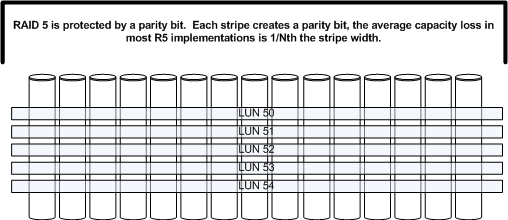
My testing was run against drive f: which is LUN 50 which resides on the 15 drive R5 group depicted above.  LUNs 51, 52, 53 and 54 were not being used so the RG was only being used by the benchmark I was running on LUN 50.

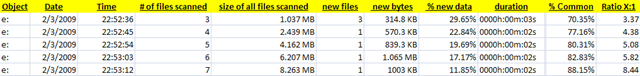
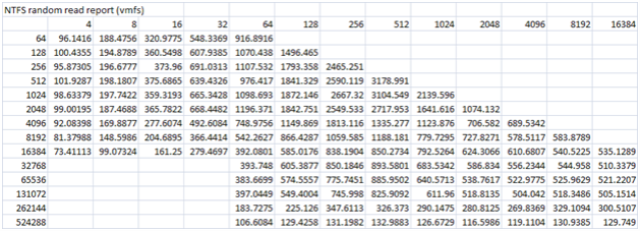
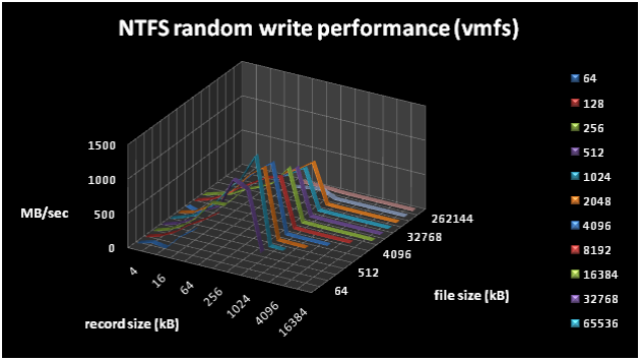
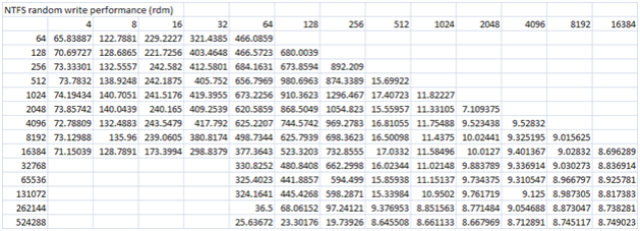
Figure 2:  Benchmark results before cache was enabled

Pre-cache

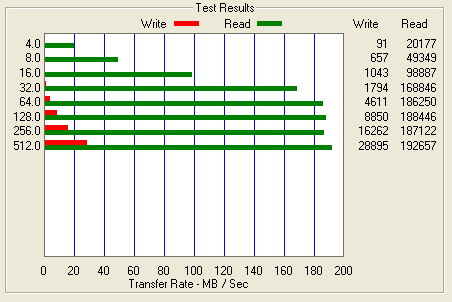
As you can see the performance for writes is abysmal.  I will focus on the 64k test as we progress through the rest of this blog.  You will see above that the 64k test only push ~ 4.6 MB/s.  Very poor performance for a 15 drive stripe.  I have a theory for why this is but I will get to that later in the post.

Before cache couple be enabled we needed to power the second power supply on the the SPS, this was done by plugging the B power supply on the SPS into the A side power rail.  Once this was complete and the SPS battery was charged cache was enabled on the CX and the benchmark was run a second time.

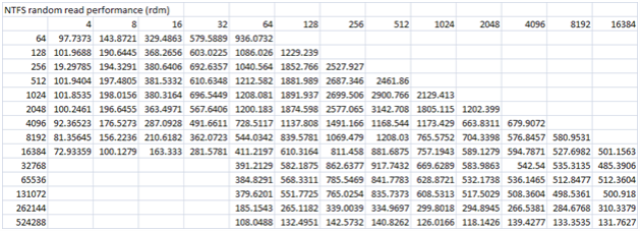
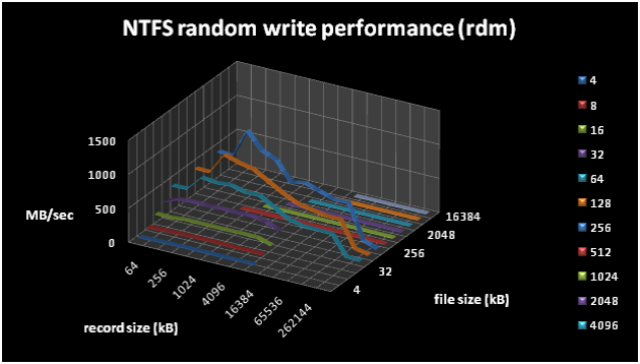
Figure 3:  Benchmark results post cache being enabled (Note the scale on this chart differs from the above chart)

Post-cache

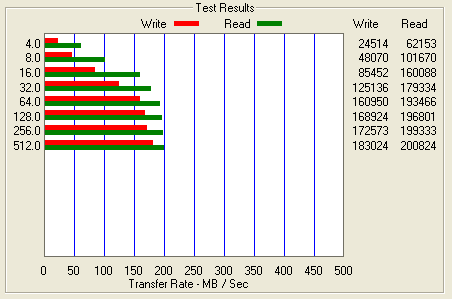
As you can see the performance increased from ~ 4.6 MB/s for 64k writes to ~ 160.9 MB/s for 64k writes.  I have to admit I would not have expected write cache to have this dramatic of an effect.

After thinking about it for a while I formulated some theories that I hope to fully prove out in the near future.  I believe that the performance characteristics that presented themselves in this particular situation was a combination of a number of things, the fact that the stripe width was 15 drives and cache being disabled created the huge gap in performance.

Let me explain some RAID basics so hopefully the explanation will become a bit clearer.

A RAID group had two key components that we need to be concerned with for the purpose of this discussion:

  1. Stripe width – which is typically synonymous with the number of drives in the the raid group
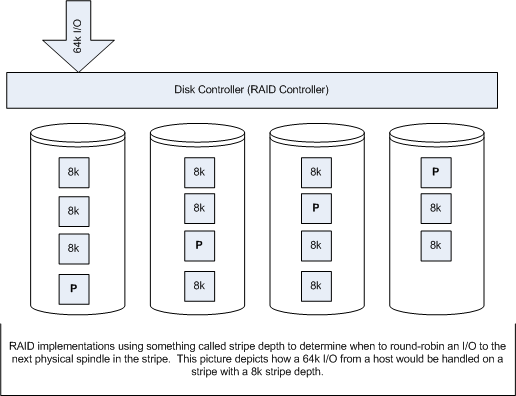
  2. Stripe depth – which is the size of the write that the controller performs before it round robin to the next physical spindle (Depicted in Figure 4)

Figure 4: Stripe Depth

Stripe_depth

The next concept is write cache, specifically two features of write cache know as write-back cache and write-gathering cache.

First lets examine the I/O pattern without the use of cache.  Figure 5 depicts a typical 16k I/O on an array with and 8k stripe depth and a 4 drive stripe width, with no write cache.

Figure 5:  Array with no write cache

No_cache

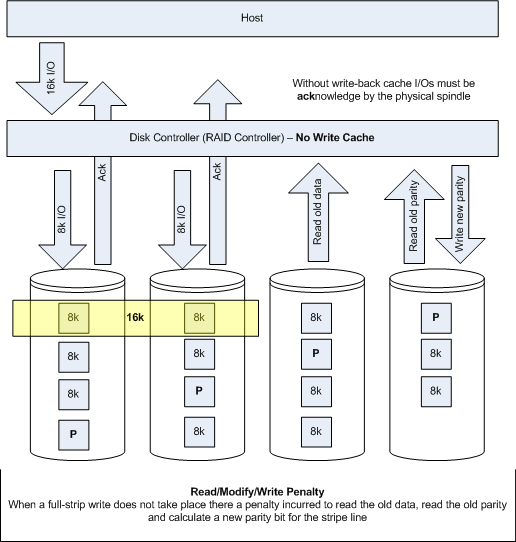
The effect of no write cache is two fold.  First there is no write-back so the I/O needs to be acknowledge by the physical disk, this is obviously much slower that and ack from memory.  Second, because there is no write-gathering full-stripe writes can not be facilitated which means more back-end I/O operations, affectionately referred to as the Read-Modify-Write penalty.

Now lets examine the same configuration with write-cache enabled.  Depicted in Figure 6.

Figure 6:  Array with write cache enabled

W_cache

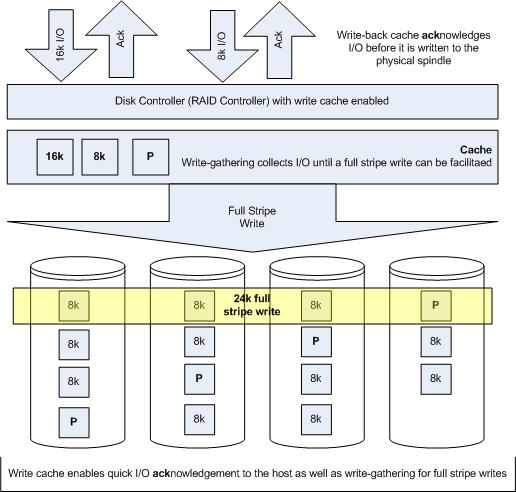
Here you will note that acks are sent back to the host before they are written to physical spindles, this dramatically improves performance.  Second write-gathering cache is used to facilitate full-stripe writes which negates the read-modify-write penalty.

Finally my conclusion is that the loss of write cache could be somewhat negated by reducing stripe widths from 15 drives to 3 or 4 drives and creating a meta to accommodate larger LUN sizes.  With a 15 drive raid group the read-modify-write penalty can be severe as I believe we have seen in Figure 2.  This theory needs to be test, which I hope to do in the near future.  Obviously write-back cache also had an impact but I am not sure that is was as important as write-gathering in this case.  I could have probably tuned the stripe-depth and file system I/O size to improve the efficiency without cache as well.

vmfs and rdm performance characteristics

It seems as if one of the most debated topics related to VMware and I/O performance is the mystery sounding the relative performance characteristics of vmfs volumes and rdm (Raw Device Mode) volumes.

Admittedly it is difficult to argue with the flexibility and operational benefits of vmfs volumes but I wanted to measure the characteristics of each approach and provide some documentation that could be leveraged when making the decision to use vmfs or rdm.? By no means are these test concluded but I thought as a gathered the data I would blog it so it could be used prior to me completing the whitepaper which all these tests will be part of.

Benchmark configuration:
The benchmarks contained in this document were performed in a lab environment with the following configuration:

  • Physical Server:? Dell dual CPU 2850 w/ 4 GB RAM
    • Windows 2003 SP2 Virtual Machine
    • Single 2.99 Ghz CPU
    • 256 MB RAM (RAM configured this low to remove the effects of kernel file system caching)
  • Disk array
    • EMC CLARiiON CX500
    • Dedicated RAID 1 Device
    • 2 LUNs Created on the RAID 1 Storage Group
    • Two dedicated 10 GB file systems
      • c:\benchmark\vmfs
        • 10 GB .vmdk created and vmfs and NTFS file system created
      • c:\benchmark\rdm
        • 10 GB rdm volume mapped to VM and NTFS file system created?

Benchmark tools:
Benchmark tests thus far were run using?two popular?disk and file system benchmarking tools.

IOzone Benchmarks:

HDtune benchmarks:

HD Tune: VMware Virtual disk Benchmark
Transfer Rate Minimum : 54.1 MB/sec
Transfer Rate Maximum : 543.7 MB/sec
Transfer Rate Average : 476.4 MB/sec
Access Time : 0.4 ms
Burst Rate : 83.3 MB/sec
CPU Usage : 36.9%

HD Tune: DGC RAID 1 Benchmark
Transfer Rate Minimum : 57.1 MB/sec
Transfer Rate Maximum : 65.3 MB/sec
Transfer Rate Average : 62.4 MB/sec
Access Time : 5.4 ms
Burst Rate : 83.9 MB/sec
CPU Usage : 13.8%

One thing that is very obvious is that VMFS makes extensive use of system/kernel cache.? This is most obvious in the HDtune benchmarks.? The increased CPU utilization is a bit of a concern, most likely due to the caching overhead.? I am going to test small block random writes while monitoring CPU overhead, my gut tells me that small block random writes to a VMFS volume will tax the CPU.? More to come….