
 So anyone who knows me knows I am huge fan of Open Source. Traditionally there have been lots of great open source projects focused on network management like GroundWork, OpenNMS and Nagios to name a few. Open Source storage projects are few and far between which is why I was so excited a few years back when the Aperi project was announced. I have been tracking the progress of the project over the past few years and I recently invested the time to do the installation and configuration required to see what sort of value it could deliver today and if it was ready for prime time. Aside from the fact that the user interface relies on a java client as opposed to being a web based application I was pleasantly surprised by the stability, functionality and overall usefulness of the application. My goal in this blog is to highlight some of the finer points of the application which supports everything from reporting to physical configuration.
For my lab in configuration I am running the Aperi server / console on a Windows 2003 VM, I have a physical Windows 2003 server connected via fibre channel to a Cisco 9124 fibre channel switch and an EMC CLARiiON CX3-10 connected to the same Cisco 9124. Solutions Enabler is installed on the physical Windows 2003 server and a LUN is mapped from the CX3-10 to the physical windows 2003 server.
An Aperi host agent is running on the Aperi server (aperi-vm) and also on the Windows 2003 physical server (w2k3phys1) which is connected to the EMC CLARiiON.
I will now walk you though a few Aperi features, my configuration is just for testing so it is not perfect but good enough to provide a taste of the power that the Aperi project is delivering. This is also by no means a comprehensive overview of the product but rather an introduction some of the features, I am hoping to create a video in the near future, time permitting.
Figure 1: The Aperi Dashboard
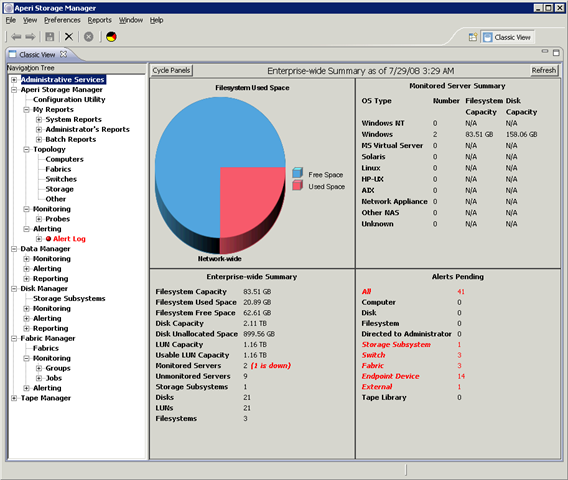
The Dashboard provides an overview of your storage environment. The left hand navigation tree makes it easy to move between task while the quadrants on the right provide information about managed elements, capacity and utilization.
Note: Some of the screenshots below have been cropped to improve clarity, the navigation tree is actually always visible on the left.
From here we will click on the Topology and we will be presented with high-level topology (Figure 2: Topology) which shows all the elements of the SAN.
Figure 2: Topology
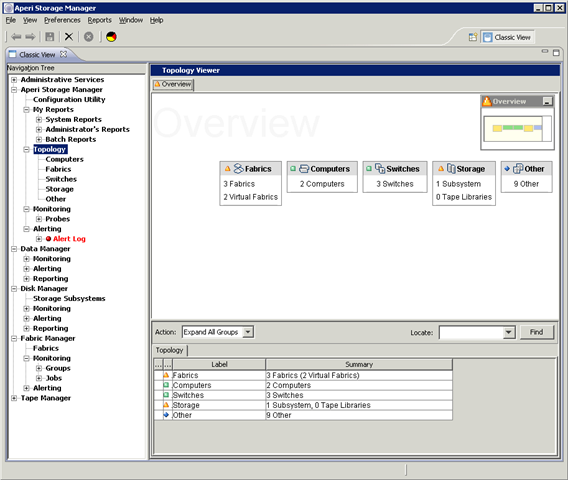
You notice above that in the high-level topology we can see information about the fabrics, computers, switches, storage devices and other which are elements that are connected to the SAN but are unidentifiable. I this case an EMC Celerra and RecoverPoint Appliances.
Next we will view the topology from different perspectives, when we click on Computers we are then presented with Figure 3: Computer Topology View.
Figure 3: Computer Topology View
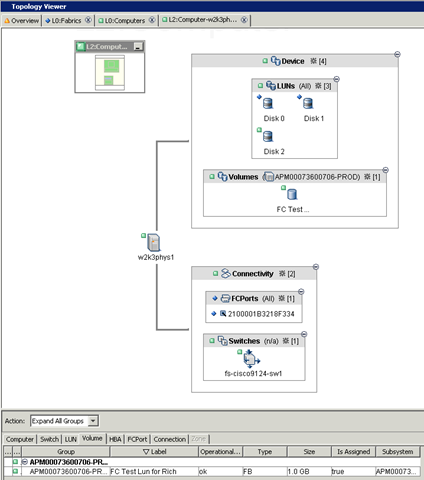
When we drill down in the computer topology view we can see that the HBA in the host w2k3phys1 is connected to a port on the Cisco 9124 and the WWN is also displayed. We can also see that 1 volume (in CX terms a LUN) is mapped to the host w2k3phys1 and identified by the label "FC Test Lun for Rich".
NOTE: The application uses SNIA terminology so it does not map directly to the terms used by the CLARiiON. This can be a little but confusing but once you understand how Aperi references luns, volumes, raid groups, etc… it is not a big deal.
Next we will navigate to the Figure 4: Fabric Topology View.
Figure 4: Fabric Topology View
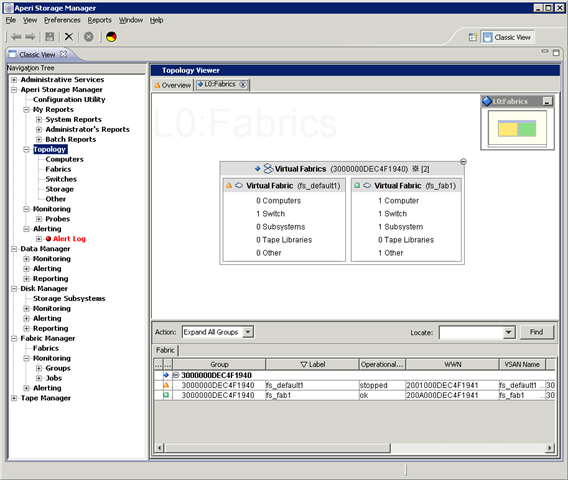
You you will notice here is that 2 Virtual Fabrics are shown, these are synonymous with Cisco VSANs. Here we can see each VSAN and at-a-glance what is attached to each VSAN. Next I will drill down on the individual VSANs (Switches) Figure 5: Switch Topology View, my personal favorite topology view.
Figure 5: Switch Topology View
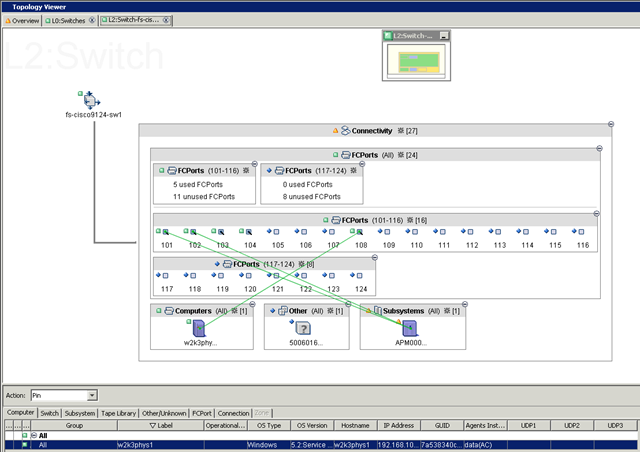
Here you can easily visualize and gather information about the SAN. We can see that there are 2 connections from the CLARiiON to port 101 and 102 and one connection from the host w2k3phys1 to port 108. There is also one unknown device connected to port 104 (the reason there is no line is because physical connectivity lines are established by clicking on either the initiator or target object, multiple objects are selected by holding down the CTRL key, very intuitive).
We can also look at the storage topology Figure 6: Storage Topology View another one of my personal favorites.
Figure 6: Storage Topology View
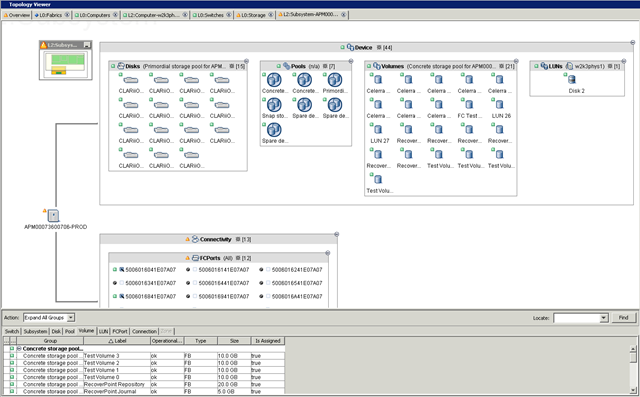
Here we view the physical CLARiiON configuration. The physical drives, storage groups and LUNs. We can also see what switch(es) and ports the CLARiiON is connected to.
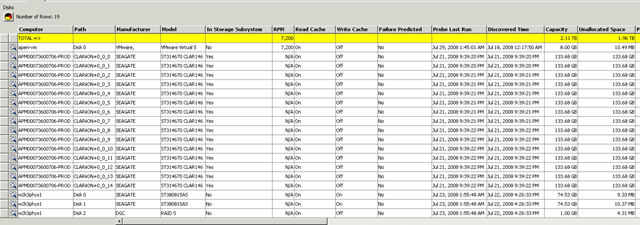
In addition to being able to view interactive topologies from a number of different perspective, reports can also be run on many different aspects of the storage infrastructure. In Figure 7: Physical Storage Report we can see all the physical devices across the environment from both the array and host perspective, reports can be filtered to only show array physical storage, host physical storage, etc…
Figure 7: Physical Storage Report
Along with interactive topologies and reporting the Aperi project offers the ability to configure and provision. Volumes can be created and provisioned through the Aperi GUI, pretty cool!
Figure 8: Create a Volume Wizard
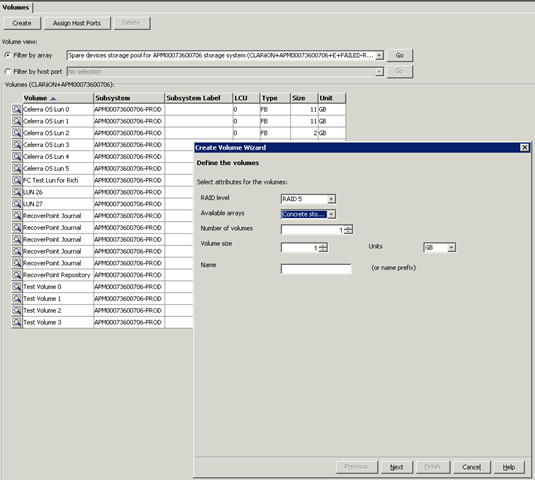
Here a LUN can be created and labeled. Chose the RAID type, array (RAID Group), number of volumes (luns) to be created, the volume (lun) size and label and click next and you can assign the volume to a host port to make it accessible.
While the Aperi project definitely has some growing up to do this is a remarkable tool given the current state of Open Source storage management tools. Hopefully this spurs OSI (Open Source Initiative) to focus on development of Storage Management tools, I will continue to watch the progress and do more testing and hopefully find the time to publish some additional findings.