FC, FCoE, iSCSI, HyperSCSI, etc…

Just finished reading Mark Lewis’ latest blog in which Mark talks about the evolution of Fibre Channel to FCoE (Fibre Channel over Ethernet).  I have to agree that the convergence at the network layer will continue and the maturity and pervasiveness of Ethernet will surely prevail over FC (fibre channel).  Interestingly enough HyperSCSI or SCSI-over-Ethernet did not prevail over iSCSI.  This could be due to the fact that there was a FC alternative.  I have a theory that with the exception of the largest of shops most organizations are looking to converge and consolidate network infrastructure.  Most of these shops are looking to leverage functionally available in Layer 3 and Layer 4, while there is a obvious performance benefit of a direct storage connection at Layer 2 for many shops this does not outweigh their familiarity and comfort with the functionality provided at Layer 3 and 4.  For example, IPsec or OSPF – The Fibre Channel community has developed equivalents to some of the functionality that we see in the IP world, for example OSPF in the  Fibre Channel world is FSPF (Fabric Shortest Path First).  The big question in my mind is do we continue to build develop functionality at the transport and network layer or does the storage industry focus on the transport layer (Layer 4) and let the networking industry focus on the network layer (Layer 3), data link layer (Layer 2) and the physical layer (Layer 1) seems to make more sense to me from a long term perspective.  Not sure why the storage industry should be reinventing OSPF, RIP, EIGRP, IPsec, etc…but that is just my opinion – but based on the recent adoption rate of iSCSI I think it might be the opinion of others as well.

Trending in the right direction…

As you may or may not know Google continued is acqusition rampage and recently acquired FeedBurner.  I don’t ususally check my FeedBurner stats but after finding out about the Google acqusition and the fact that Google made all of the FeedBurner Pro Stats availabe for free as they do with most of their acqusitions, I wanted to make sure I was taking advantage of the pro fetures and in fact they were now availble to me but I need to activate them.  While logged in I noticed that gotITsolutions.org traffic is trending nicely.  Thank you for visiting and I hope that you are all finding the content worthwhile.

Relieve the pressure…

This may not be the most appropriate post or mobile application but it is a problem that many of us who live, travel and work in the New York City area struggle with almost daily.  Many days I find my self headed for the 2 or 3 train from downtown to mid-town and it would be really nice to relieve myself before the 15 minute subway ride.  Well if you spend much time in NYC you know this can be a challenge, even if you are lucky enough to locate a restroom there is a high probability that the door is probably locked.  Well the problem is being solved by Yojo Mobile and an application called MiZPee.

Performance Analysis

So let me set the stage for this blog. I recently completed a storage assessment for a customer. Without boring you with the details one of the major areas of concern was the Exchange environment, I was provided with proem data from two active Exchange cluster member to be used for analysis. The proem data was collected on both cluster members over the course of a week at 30 second intervals – THAT’S ALOT OF DATA POINTS. Luckily the output was provided in .blg (binary log) format because I am not sure how well Excel would have handled opening a .CSV file with 2,755,284 rows – YES you read that correctly 2.7 million data points – and that was after I filtered the counters that I did not want.

The purpose of this post is to walk through how the data was ingested and mined to produce useful information. Ironically having such granular data point while annoying at the onset proved to be quite useful when modeling the performance.

First let’s dispense with some of the requirements:

  • Windows XP, 2003
  • Windows 2003 Resource Kit (required for the log.exe utility)
  • MSDE, MSSQL 2000 (I am sure you can use 2005 – but why – it is extreme overkill for what we are doing)
  • A little bit of skill using osql
    • If you are weak 🙂 and using MSSQL 2000 Enterprise Manager can be used
  • A good SQL query tool
  • MS Excel (I am using 2007 – so the process and screen shots may not match exactly if you are using 2003, 2000, etc…)
    • Alternatively a SQL reporting tool like Crystal could be used. I choose Excel because the dataset can easily be manipulated once in a spreadsheet.
  • grew for Windows (http://gnuwin32.sourceforge.net/packages/grew.htm) – ensure this is in your path

OK – now that the requirements are out of the way let’s move on. I am going to make the assumption that the above software is installed and operational, otherwise this blog will get very, very long. NOTE: It is really important that you know the “sa” password for SQL server.

Beginning the process:

Step 1: Create a new data base (my example below uses the data base name “test” – you should use something a bit more descriptive)

Microsoft Windows XP [Version 5.1.2600]
(C) Copyright 1985-2001 Microsoft Corp.

C:\Documents and Settings\bocchrj>osql -Usa
Password:
1> create database test
2> go
The CREATE DATABASE process is allocating 0.63 MB on disk ‘test’.
The CREATE DATABASE process is allocating 0.49 MB on disk ‘test_log’.
1> quit

C:\Documents and Settings\bocchrj>

NOTE: This DATABASE will be created in the default DATA location under the SQL SVR install directory. Make sure you have enough capacity – for my data set of 2.7 million rows the database (.mdf) was about 260 MB.

Step 2: Create an ODBC connection to the database

A nice tutorial on how to do this can be found here: http://www.truthsolutions.com/sql/odbc/creating_a_new_odbc_dsn.htm

Two things to note:

  • Use the USER DSN
  • Use SQL Server Authentication (NOT NT Authentication) the user name is “sa” and hopefully you remembered the password.

Step 3: Determine relevant counters

Run the following command on the .blg file: log -q perf.blg > out.txt

This will list all of the counters to the text file out.txt. Next open counters.txt in you favorite text editor and determine which counters are of interest (NOTE: Life is much easier if you import a specific counter class into the database, create new a new database for a new counter class)

Once you determine the counter class e.g. PhysicalDisk run: log -q perf.blg | grew PhysicalDisk > counters.txt

Step 3: Import the .blg into the newly created database.

  • NOTE: There are two considerations here

    • Are the data points contained in a single .blg file (if you have 2.7 million data points this is unlikely)? If they are the command to do the import is fairly simple:

      • log perf.blg -cf counter.txt -o SQL:DSNNAME!description

    • If the data points are contained in a number of files make sure that these files are housed in the a directory. You can use the following PERL script to automate the import process (NOTE: This requires that PERL be installed – http://www.activestate.com/Products/ActivePerl/)

#!/usr/bin/perl -w

# syntax: perl import_blg.pl input_dir odbc_connection_name $counter
# e.g. – perl import_blg_pl

#DO NOT EDIT BELOW THIS LINE
$dirtoget=”$ARGV[0]”;
$odbc=”$ARGV[1]”;
$counter=”$ARGV[2]”;
$l=0;

opendir(IMD, $dirtoget) || die(“Cannot open directory”);
@thefiles= readdir(IMD);
closedir(IMD);

foreach $f (@thefiles)
{
unless ( ($f eq “.”) || ($f eq “..”) )
{
$label=$l++;
system “log \”$dirtoget\/$f\” -cf $counter -o SQL:$odbc!$label”;
}
}


  • If the import is working properly you should see output similar to the following:

Input
—————-
File(s):
C:\perf_log – 30 second interval_06132201.blg (Binary)

Begin: 6/13/2007 22:01:00
End: 6/14/2007 1:59:30
Samples: 478

Output
—————-
File: SQL:DSNNAME!1.blg

Begin: 6/13/2007 22:01:00
End: 6/14/2007 1:59:30
Samples: 478

The command completed successfully.

Step 4: OK – The data should now be imported into the database. We will now look at the DB structure (table names) and run a test query. At this point I typically start using SQL Manager 2005 Lite but you can continue to use osql or Enterprise Manager (uggghhhh). For the purposes of cutting and pasting examples I used osql.

  • This is not a DB 101 tutorial but you will need to be connected to the database we created earlier.

  • Once connected run the following query (I cut out non relevant information in the interest of length):

C:\Documents and Settings\bocchrj>osql -Usa
Password:
1> use test
2> go
1> select * from subjects where type = ‘u’ order by name
2> go
CounterData
CounterDetails
DisplayToID

(3 rows affected)
1>

CounterData and CounterDetails are the two tables we are interested in:

Next lets run the query to display the first 100 rows of the CounterDetails table to verify that the data made its way from the .blg file to the database

1> select top 20 * from counterdetails
2> go
SHOULD SCROLL 20 RECORDS
(20 rows affected)
1>quit

Step 5: Determining what to query

Open counters.txt in your favorite browser and determine what you want to graph – there are a number of metrics, pick one you can get more complicated once you get the hang of the process.

e.g. When you open the text file you will see a number of rows that look like this – Take note of bold sections below, this is the one of the filters that will be used when selecting the working dataset

\test\PhysicalDisk(4)\Avg. Disk Bytes/Read
\test\PhysicalDisk(5)\Avg. Disk Bytes/Read
\test\PhysicalDisk(6 J:)\Avg. Disk Bytes/Read
\test\PhysicalDisk(1)\Avg. Disk Bytes/Read
\test\PhysicalDisk(_Total)\Avg. Disk Bytes/Read
\test\PhysicalDisk(0 C:)\Avg. Disk Write Queue Length
\test\PhysicalDisk(3 G:)\Avg. Disk Write Queue Length
\test\PhysicalDisk(4)\Avg. Disk Write Queue Length
etc…

Once you determine which performance counter is of interest open Excel.

Step 6: Understanding the anatomy of the SQL query

SELECT
CounterData.”CounterDateTime”, CounterData.”CounterValue”,
CounterDetails.”CounterName”, CounterDetails.”InstanceName”
FROM
{ oj “test“.”dbo”.”CounterData” CounterData INNER JOIN “test“.”dbo”.”CounterDetails” CounterDetails ON
CounterData.”CounterID” = CounterDetails.”CounterID”}
WHERE
CounterDetails.”InstanceName” = ‘3 G:‘ AND CounterDetails.”CounterName”=’Disk Writes/sec‘ AND CounterData.”CounterDateTime” like ‘%2007-06-13%’

  • The above query will return all the Disk Writes/sec on 6/13/2007 for the G: drive.
  • In the above query I have BOLDED the VARIABLES that should be modified when querying the database. The JOINS should NOT be modified. You may add additional criteria like multiple INSTANCENAME or COUNTERNAME fields to grab, etc…. Below you will see exactly how to apply the query.

Step 7: Run the query from Excel (NOTE: Screen shots are of Excel 2003, the look and feel will be different for other versions of Excel)

ex-query1

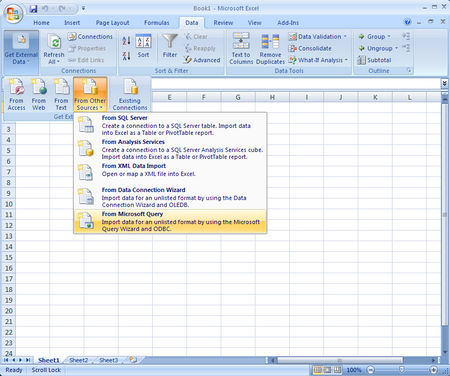
Once you select “From Microsoft Query” the next screen will appear

dsn

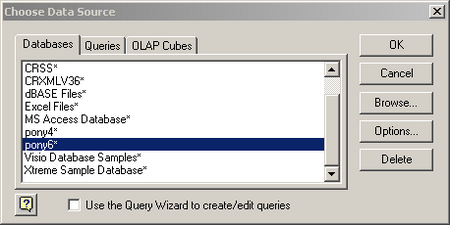
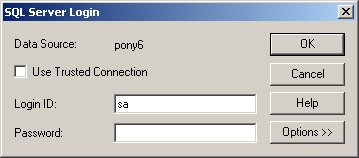
Select the DSN that you defined earlier. NOTE: Also uncheck the “Use the Query Wizard to create/edit queries. I will provide the query syntax which will make life much easier.Now you need to login to the database. Hopefully you remember the sa password.

login add

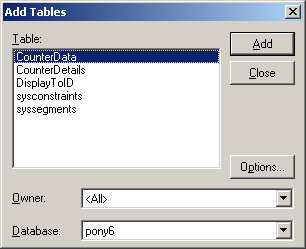
Once the login is successful – CLOSE the add tables window

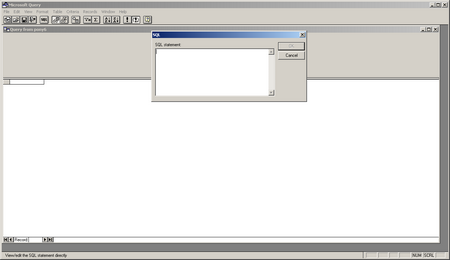
Now you will see the MS Query Tool Click the SQL button on the toolbar. Enter the SQL query into the SQL text box and hit OK. You will recite a warning – just hit OK and continue.

Use the query syntax explained above.

sql

Once the query is complete it will return a screen that looks like this:

q

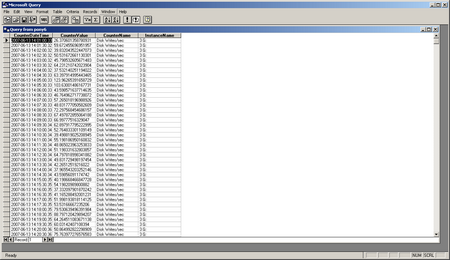
Now hit the 4th button from the left on the tool bar “Return Data” – this will place the data into Excel so that is can be manipulated:

e

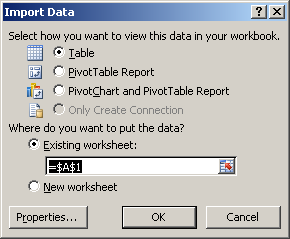
Once the data is placed into Excel you can begin to graph and manipulate it.

out

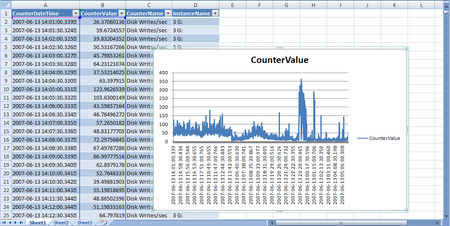
I hope this was informative, if you find any errors in the process please place a comment to the post.

It’s been a busy month

Following my return from EMC World there has been some major activity in the trenches. The blog has suffered at the hands of the 24hr day. I suppose someone will eventually figure out that 24 hrs just does NOT work any longer. Nonetheless I am back with a vengeance and have two great blogs to post. In chronological order the first one has to due with troubleshooting a WAAS / application performance issue and the second one has to do with performance analysis and performance data mining. My plan is to actually publish the performance analysis information blog(freshest in my mind) followed by the WAAS / application document blog.

Best practices for building and deploying virtual appliances – from EMC World 2007

High-level guidelines for building a Virtual Appliance:

  • Start with a new VM
    • Use SCSI VMs for portability and performance
    • Split into 2GB files for size and portability
    • Allocate minimum required mem to the vm (clearly document this)
    • Disable snapshots, do not include snapshot files
    • Remove unused hardware devices
      • i.e – USB, audio, floppy, etc…
      • start devices such as floppy, cd, etc… disconnected
    • Disable “Shared Folders”
    • Avoid the use of serial and parallel ports or other specialty features
    • Chose the proper network type – Bridged is the the default but there may be a situation to use NAT
  • Install “JEOS” – Just Enough OS
    • Select the Linux distribution of your choice (pick a supported guest to make life easier on yourself – Note: if you use RHEL or SLED you will need to get permission to distribute)
      • Minimize he footprint
        • only install and run necessary services
        • only open necessary ports
        • more secure and less to patch
      • Install VMware Tools
        • Improved performance, optimized drivers for virtual hardware, etc…
        • Hooks to management tools
        • Fully redistribute able inside Linux guests
      • Include or enable users to add a second virtual disk
        • put config information: user data, logs files, etc… on second disk
        • easier to update and backup the virtual appliance
  • Install the applications stack
  • Configure the appliance for first boo
    • Console experience
      • Accept EULA
      • “Zero-Configuration”
      • Present management URL
    • Web management interface
      • Configure networking
      • Configure security
    • Monitor and manage performance of the solution
    • Test everything! Test first boot/complete execution on different machines
  • Value-Add
    • Expose logging from underlying services
    • Support SNMP
    • Provide audit hooks
    • Allow users to backup configurations and/or restore to factory default settings
  • Package the virtual appliance
    • Copy appliance to new directory
    • Remove unecessary files
      • log files, nvram file, etc..
    • Add your “Getting Started Guide” or “ReadMe”
    • Compress the entire directory
      • 7-Zip or RAR work very well
      • Use cross-platform compression technology
    • Create a web page to host your virtual appliance download
    • Certify your virtual appliance
    • Create a listing on http://vam.vmware.com
  • Provide a patch mechanism for your virtual appliance
    • leverage the default packaging technology of the OS (i.e. .deb or .rpm) or build your own packaging and update technology
    • Support direct online updates from your servers
    • support offline patching

Available tools, frameworks and services:

  • VMware Virtual Appliance Development Kit
    • under development – used as part of Ace 2.0
    • Web-based virtual appliance development tool
    • Includes rPath Linux distro
    • Includes its own patching solution
    • Service provider
    • Developing their own framework
    • Service provider

Greetings from EMC World 2007

It’s that time of year again… EMC World 2007 kicked off yesterday with a keynote by Joe Tucci.  How the industry has changed over the past 6 years.  Discussions which 6 years ago centered around back-end infrastructure, performance, SLAs, etc… all supporting B2B applications and corporate infrastructure have been replaced by discussions primarily focused on consumer applications such as YouTube, MySpace, Facebook, etc…  I am looking forward to Mark Lewis’ keynote tomorrow which he entitles “living in a 2.0 world”.  The need has always been created bu the consumer space but never in history has the consumer had the level of visibility into the back-end infrastructure that they do today.  Users today immediately know when site like YouTube and Facebook are offline, when their cell phones gps is down, when IM is offline, when they can’t download music from iTunes and the list goes on and on.  Social networking sites have proven that they will become if not already a primary communication medium, they are the new brick and mortar businesses.  Welcome to the 2.0 world.

A final thought, last night I had dinner at Charley’s Steak House, my good friend at recoverymonkey.org exercised his poetic culinary license last night.  I suggest checking it out.