Most environments running VMware would like some way to backup, protect and revision VMs. There are a number of commercial products that do a good job protecting VMs; products such as Veeam Backup and Replication, Quest Software (formerly Vizioncore ) vRanger and PHD Virtual Backup to name a few. This post will focus on the implementation of much lower cost (free) implementation of a backup and recovery solution for VMware. As with any free or open source software there is no right or wrong implementation model so this is a post that will talk about how ghettoVCB was implemented with Data Doman to enhance the protection of VMs.
Why?…
What was the driver behind the requirement for image level protection of VMs in this particular instance? Within the particular environment that I am referencing in this post the customer has a fairly large ESX farm at their production site. Most of the production infrastructure is replicated to a DR location with the exception of some of the “less critical” systems. The DR site also has some running VMs such as domain controllers, etc… also deemed “less critical” so these are not replicated. You may ask why these are not replicated, the short answer is the customer uses EMC RecoverPoint to replicate data from Site A to Site B in conjunction with VMware SRM to facilitate failover, until recently (VNX) RecoverPoint had a capacity based license so dollars were saved by only replicating critical systems. Backups are taken of all systems but this does not provide the ability to restore an older VM image. A storage migration was being done from an older SAN infrastructure to a new SAN infrastructure, the migration was deemed completed but there was one VMFS volume that was missed and never migrated, the OEM was contracted to a do a date erasure on the old SAN prior to removing it from the data center. It was at that time that the “less critical” systems were lost and everyone realized that they were not really “less critical”. VMs needed to be rebuilt, this was labor intensive and could have been avoided had a good VM backup strategy been in place.
Discussions around how to protect against this in the future started to occur, the interesting thing was as part of the new infrastructure Data Domain was implemented as a backup to disk target but there was no money left in the budget to implement a commercial VMware image level backup product. vGhetto ghettoVCB to the rescue! With a little bit of design vGhetto was implemented on all the ESX servers and has been running successfully for over a year.
How to get started…
Download the appropriate ghettoVCB code from the vGhetto Script Repository there are multiple versions (you should use the latest version, the implementation discussed in this post uses ghettoVCBg2). All of the prerequisites and usage is well documented on the vGhetto site. Take your time and read, don’t jump in to this without reading the documentation.
Note: You will have to edit configuration files for vGhetto to setup alerts, retention, backup locations, etc… be sure to read the documentation carefully.
The Implementation details…
High-level Topology
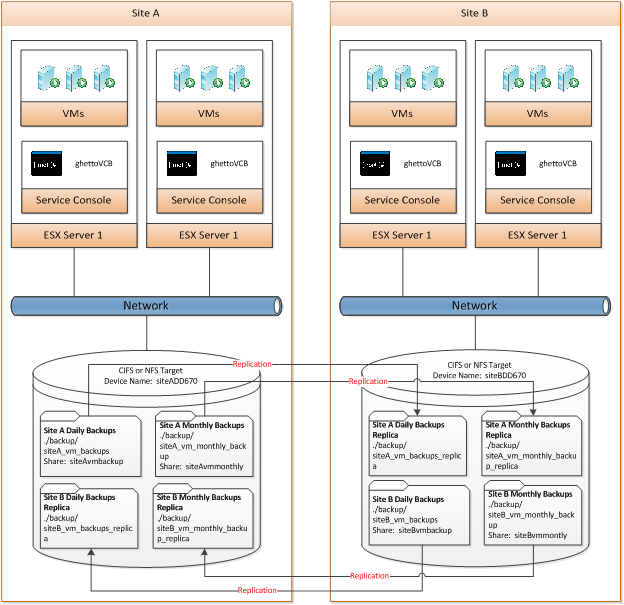
Note: Site A and Site B backups target share on each respective DD670 (e.g. \\siteADD670\siteAvmbackup for daily backups at Site A) these are replicated to the peer DD670. Replicated data is accessible at the target side by accessing the backup sharename (e.g. – \\siteADD670\siteAvmbackup replicated data would be accessible by accessing \\siteBDD670\backup\siteA_vm_backup_replica).
In the environment that this deployment was done all of the ESX servers are running ESX 4.1 full (not ESXi) so the service console was leveraged, deployment models can differ from using the remote support console to using the vMA (vSphere Management Assistant). This is why it is critical that you read the ghettoVCB documentation.
Step-bt-Step…
- Develop and document an architecture / design, this will require a little planning to make deployment as easy as possible.
-
Create a CIFS of NFS share on the Data Domain or other CIFS/NFS target.
- If you want to keep the cost to nearly zero I recommend Opendedup
- In this case Data Domain 670s already existed in both locations
- I created two shares in each location one for daily backups and one for monthly backups (see High-level topology)
The reason for two shares is that only one (1) monthly is retained on the monthly share and fourteen (14) daily backups are maintained on the daily share. There is a tape backup job monthly that vaults the VM image backups from the monthly share.
- There are basically three tasks that need to be performed on every ESX server in the environment:
- Mount the target backup share(s):
- Create mountpoint: mkdir /mnt/backup
- For NFS: mount servername|IP:/sharename /mnt/backup
- For CIFS: mount -t cifs //servername|IP /sharename /mnt/backup -o username=USERNAME,password=PASSWORD
- Add the target backup share(s) to /etc/fstab to make them persistent:
- For CIFS: echo “//servername|IP /sharename /mnt/backup cifs credentials=/root/.smbcreds” >> /etc/fstab
- For NFS: echo “servername|IP: /sharename /mnt/backup nfs [any NFS mount options] ” >> /etc/fstab
- Create cron job(s):
- Daily Job (runs Mondy thru Friday at midnight): 0 0 * * 1-5 root /mnt/backup/.files/ghettoVCB/ghettoVCB.sh -a > /mnt/backup/.files/logs/`hostname`_ghettoVCB.log 2>&1
- Monthly Job (runs Saturday at midnight): 0 0 * * 6 root /mnt/monthly_backup/.files/ghettoVCB/ghettoVCB.sh -a > /mnt/monthly_backup/.files/logs/`hostname`_ghettoVCB.log 2>&1
Note: crontab entries need to go in /etc/crontab. If you place them in the user crontab using crontab –e or vi /var/spool/cron/root it will NOT work.
Deployment…
Once you complete the above steps and test on a single server you are ready to roll out to all the servers in your environment. To simplify this I recommend storing the config files, scripts, etc… in a hidden directory on the CIFS or NFS share.
In my case I have a .files directory in the daily backup and monthly backup directories. This includes the ghettoVCB code, .smbcreds file and the deployment scripts.
Deployment Scripts:
#Daily Config script
#!/bin/sh
df –h
mkdir /mnt/backup
mount -t cifs //servername|IP /siteAvmbackup /mnt/backup -o username=backup,password=p@ssword
df -h
cp /mnt/backup/.files/.smbcreds /root
umount /mnt/backup
df -h
echo "//servername|IP/siteAvmbackup /mnt/backup     cifs    credentials=/root/.smbcreds" >> /etc/fstab
cat /etc/fstab
mount -a
df -h
/mnt/backup/.files/ghettoVCB/ghettoVCB.sh -a -d dryrun
echo “0 0 * * 1-5 root /mnt/backup/.files/ghettoVCB/ghettoVCB.sh -a > /mnt/backup/.files/logs/`hostname`_ghettoVCB.log 2>&1” >> /etc/crontab
#Monthly Config Script
#!/bin/sh
df -h
mkdir /mnt/monthly_backup
mount -t cifs //servername|IP/siteAvmmonthly /mnt/monthly_backup -o username=backup,password=p@ssword
df -h
umount /mnt/monthly_backup
df -h
echo "//servername|IP/siteAvmmonthly /mnt/monthly_backup     cifs    credentials=/root/.smbcreds" >> /etc/fstab
cat /etc/fstab
mount -a
df -h
/mnt/monthly_backup/.files/ghettoVCB/ghettoVCB.sh -a -d dryrun
echo “0 0 * * 6 root /mnt/monthly_backup/.files/ghettoVCB/ghettoVCB.sh -a > /mnt/monthly_backup/.files/logs/`hostname`_ghettoVCB.log 2>&1” /etc/crontab
Note: The above scripts assumes a CIFS target, modify accordingly for a NFS target.
Deployment is easy, as new ESX servers come online using plink I remotely execute a mount of the appropriate share, copy the deployment script to /tmp and execute.
All the changes are made to the fstab, cron, etc.. and VM image backups will now run on a regular basis.
Accessing backed up data…
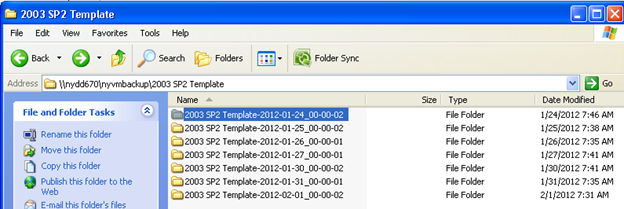
You will now be able to browse the //servername|IP/sharename from any host and see your backups organized by date:
I use vmware-mount.exe which is part of the VMware Virtual Disk Development Kit on the virtual center server to mount the backup vmdk files for individual file restores, obviously for a full restore I just copy the vmdk back to the production datastore.
The following are the key steps to mount a backed up vmdk:
- Mount the CIFS share (if using NFS you can usually share the volume via CIFS of SMB as well and gain access from windows to use the process I am outlining here)
- net use v: //servername|IP/sharename
- net use
You should see something similar to this: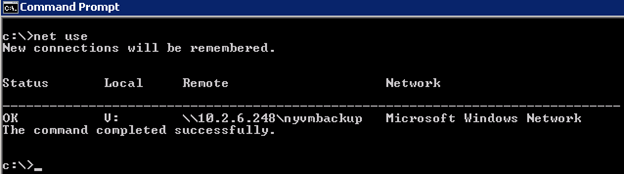
- v:
- dir (you should see all you VM backup dirs)
- cd to the VM perform a recovery from
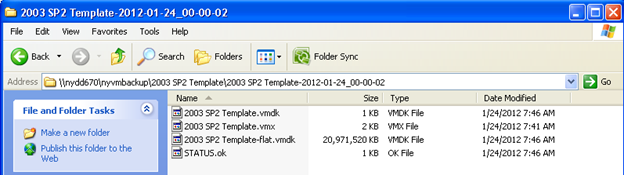
- cd to the proper backup image
- dir
This is what the above command sequence looks like: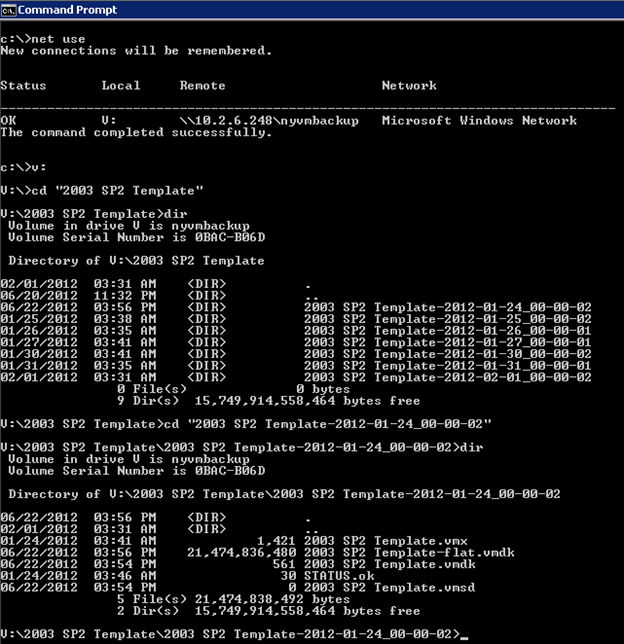
- Now mount the vmdk
- vmware-mount.exe z: “2003 SP2 Template.vmdk”
- You can verify a successful mount by just typing vmwre-mount.exe

- z:
- dir
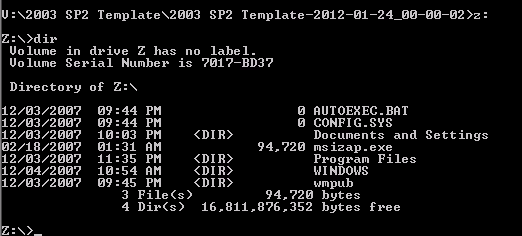
You are now looking at the c: drive from the “2003 SP2 Template” VM from January 24, 2012.
You can navigate and copy files just like any normal drive.


